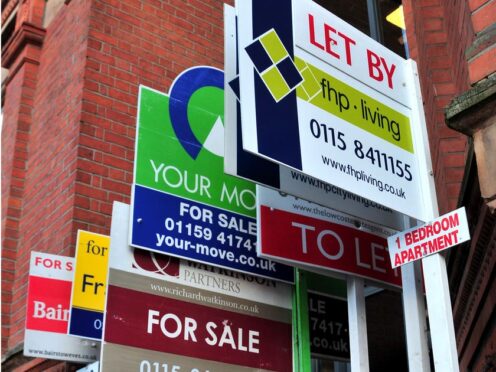
The average price of a newly marketed home jumped by more than £5,000 month-on-month in March, in signs that “we now seem to be past the bottom of the market,” according to a property website.
Across Britain, the typical price tag on a home increased by 1.5% or £5,279, Rightmove said.
The increase pushed the average asking price to £368,118.
Rightmove said the month-on-month rise was higher than the usual 1.0% average seen in March.
The average asking price is still sitting £4,776 below a peak seen in May 2023.

Both agreed sales and buyer demand are higher than this time last year, although the market remains sensitive to pricing, Rightmove said.
Attractively-priced properties are quickly being cherry-picked, but over-optimistically priced homes are taking longer to find a buyer, it added.
Tim Bannister, Rightmove’s director of property science, said: “March is typically a strong month for asking price growth, as both buyer and seller activity levels rise and the spring selling season gets under way.
“However, the stronger-than-usual price growth this March indicates that new sellers are feeling much more confident, with some perhaps being overoptimistic, that there is enough buyer activity and affordability in their local market to achieve a higher price.
“Despite the above-average price increases in this opening three months of the year, asking prices are still £4,776 below their peak in May 2023. For those who can afford to buy and have yet to take action to move this year, this may provide a window of opportunity to buy as we now seem to be past the bottom of the market.
“While some sellers are still being overoptimistic with their pricing expectations, there are also more sellers who are aware of the need to be negotiable and realistic, with elevated interest rates compared to recent years still stretching affordability for many buyers.”
The average time to find a buyer is now 71 days, which is the longest at this time of year since 2019, the website said.
Mr Bannister added: “Sellers are right to feel more confident and optimistic this year, but buyer affordability remains stretched and higher mortgage rates are an ongoing challenge. With the market still sensitive to pricing and external events, some caution and willingness to negotiate is advised for sellers who are keen to find a buyer in the spring market.”
Marc von Grundherr, director of estate agent Benham and Reeves said: “While mortgage affordability remains an issue, it certainly hasn’t dampened the appetite of London buyers and we’ve continued to see a high level of activity at all price thresholds, but particularly across the super-prime market. Buyers at the very top end of the ladder are acting with great confidence, with the higher cost of borrowing not presenting the same obstacle as the average homeowner.
“As a result, we’re seeing high demand for super-prime stock and many more buyers circling due to a more constrained supply of suitable properties in this sector.”
The figures were released as a lettings index from property firm Hamptons indicated that growth in rental prices cooled in February.
Last month, the average rent on a newly-let home in Britain rose by 7.1% annually, slowing from 8.3% in January and a peak of 12.0% in August 2023.
Rental growth is still running faster than inflation and increases mean the average tenant moving into a new property would pay an extra £87 per month or £1,044 a year more in rent than if they moved in February last year, Hamptons said.
Across Britain, the average monthly rent on a newly-let property in February was £1,317.
Aneisha Beveridge, head of research at Hamptons, said: “Lower mortgage rates have meant landlords needing to refinance in 2024 are seeing a smaller adjustment in their mortgage costs than those who remortgaged in 2023. This is slowly helping to balance mortgage investors’ books.”
Hamptons’ lettings index uses data from the Countrywide Group to track changes to the cost of renting and is based on achieved rather than advertised rents.
Enjoy the convenience of having The Sunday Post delivered as a digital ePaper straight to your smartphone, tablet or computer.
Subscribe for only £5.49 a month and enjoy all the benefits of the printed paper as a digital replica.
Subscribe