Hundreds of different contests were held across England and Wales on May 2, ranging from the election of local councillors to choosing high-profile mayors.
Now that almost all the counting is over, here are some of the key trends to emerge from the results – and the statistics behind them.
– Mayors
Labour dominated this year’s mayoral elections, notching up a string of wins by high-profile incumbents as well as scoring a clean sweep of victories in those parts of the country that were voting for a mayor for the first time.
In five of the 11 contests, Labour not only finished first but won more than 50% of the vote: Liverpool (where Steve Rotheram got 68.0%), Greater Manchester (63.4% for Andy Burnham), Salford (61.5% for Paul Dennett), South Yorkshire (50.9% for Oliver Coppard) and West Yorkshire (50.4% for Tracy Brabin).
This is no mean feat in elections held under the first-past-the-post system, where having multiple candidates on the ballot often means the winner does not end up with over half of the popular vote.
Indeed, this exact scenario happened in the five other mayoral contests won by Labour candidates: London (where Sadiq Khan got 43.8% of the vote), the North East (41.3% for Kim McGuinness), East Midlands (40.3% for Claire Ward), Birmingham (37.8% for Richard Parker) and York & North Yorkshire (35.1% for David Skaith).
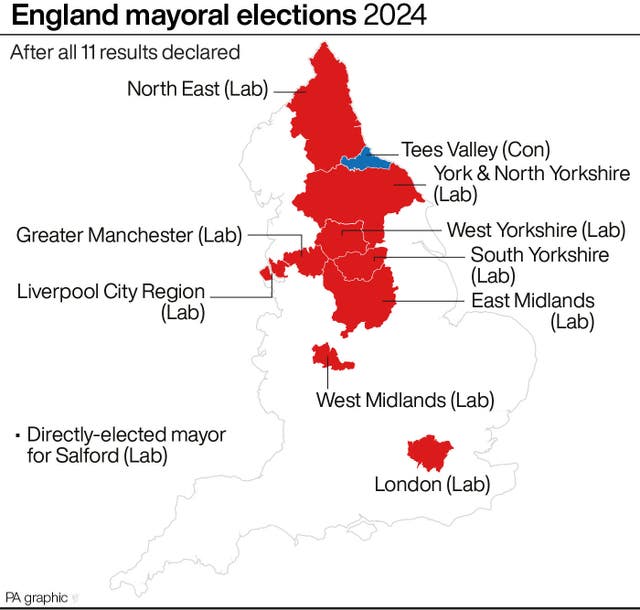
Elections for the East Midlands, North East and York & North Yorkshire mayors were being held for the first time, meaning there was no incumbency factor to boost the chances of a particular party.
They also took place in areas that will be key Conservative-Labour battlegrounds at the next general election – particularly the East Midlands which contains a high number of marginal seats.
Seen in this context, the sole Tory success in this year’s mayoral contests, the re-election of Ben Houchen in Tees Valley, is very much an outlier, though he did – like most of the other incumbents – manage to win more than half of the vote (53.6%).
Only three candidates stood in the Tees Valley contest – Conservative, Labour and Liberal Democrat – which was the lowest number in any of this year’s mayoral elections.
– Councils
Results are in from 106 of the 107 councils in England that held elections on May 2 and they show Labour has won 1,140 seats, an increase of more than 200.
The Liberal Democrats beat the Tories into second place, winning 521 seats, up nearly 100.
The Tories are just behind on 513 seats, down nearly 400.
The change in seats is the difference in the number of councillors compared with the state of the parties just before election day.
There are other ways to report the change, such as comparing this year’s results with how the parties fared the last time most of the seats were elected, though this overlooks factors such as by-elections and defections.
Independent candidates have won 228 seats, down 28, the Greens have won 181, up 64, while Reform has won two, down one.
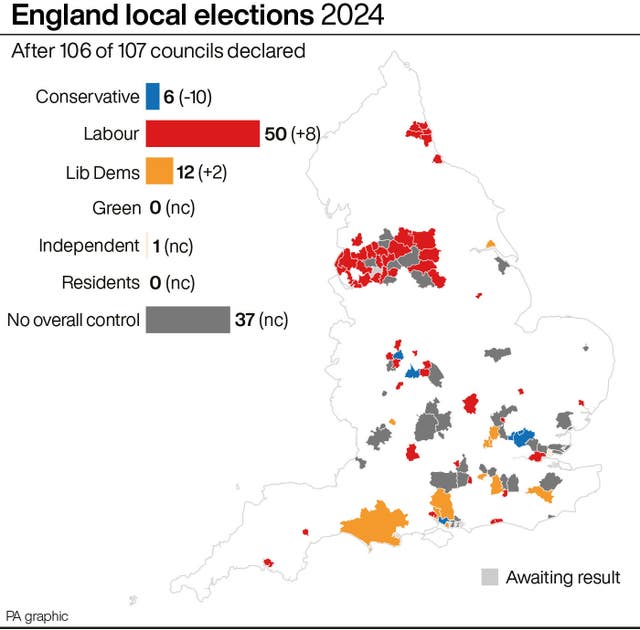
The new-look council map of England shows a continuation of the trend that emerged in last year’s local elections: a tilt away from the Conservatives and towards councils controlled by other parties or where no party has a majority.
The Tories lost control of 10 local authorities on May 2: Adur in West Sussex, Nuneaton & Bedworth in Warwickshire, Redditch in Worcestershire and Rushmoor in Hampshire to Labour; Dorset to the Lib Dems; and Basildon in Essex, Dudley in the West Midlands, Gloucester, Havant in Hampshire and North East Lincolnshire to no overall control.
They also shed councillors in many areas, including losing 12 at Stroud in Gloucestershire, 12 at Maidstone in Kent, 11 at Peterborough, 10 at Thurrock in Essex and nine at Cherwell in Oxfordshire; were reduced to just one councillor at Stevenage and Wigan; and were wiped out entirely at Castle Point in Essex, Cheltenham, Sheffield and South Tyneside.
Many of these are in parts of the country that will be key battlegrounds at the next general election, with Labour hoping to make gains from the Tories in the Midlands and the South East, and the Lib Dems eyeing the “blue wall” in the South West.
A more localised trend specific to these local elections led to Labour losing control of two councils, Oldham in Greater Manchester and Kirklees in West Yorkshire.
In both areas, Independent candidates made gains at Labour’s expense, while in Rochdale in Greater Manchester the Workers Party – led by George Galloway – gained two seats from Labour.
These changes could reflect unhappiness with Labour among some of its supporters in traditional heartlands in northern England, linked to the party’s policy towards the Israel-Hamas conflict.
Meanwhile another result that could have consequences for the general election occurred in Bristol, where the Greens made 10 gains to become the largest party on the council.
The parliamentary seat of Bristol Central is the Greens’ number one election target – and they have just won every council seat inside the constituency.
– Police & crime commissioners
With two police & crime commissioner (PCC) results still to come on Sunday, the Conservatives and Labour are currently tied on 17 each, with Plaid Cymru winning one in Wales.
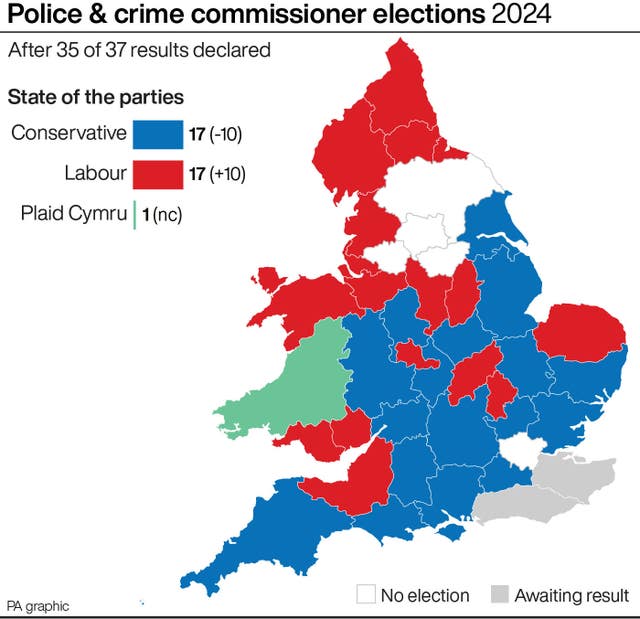
The Conservatives did extremely well the last time these elections took place in 2021, winning almost all the contests in England and making 10 gains, seven from Labour and three from Independents.
This year has proved very different, with Labour gaining 10 PCCs from the Tories across England: Cheshire, Cleveland, Cumbria and Lancashire in the north; Bedfordshire, Derbyshire, Norfolk, Northamptonshire and Nottinghamshire in central and eastern England; and Avon & Somerset in the South West.
Many of these contests saw very low turnouts, ranging from 32.3% in Northumbria to just 15.5% in Gwent.
This may reflect the fact that for many voters in England and Wales, police commissioners were the only type of election taking place in their area on May 2 – perhaps not as much of a draw as the chance to choose a high-profile mayor or their local councillor.
But the overall picture chimes with the trend evident in the mayoral and council elections: that of the Conservatives losing ground in many areas of the country.
Enjoy the convenience of having The Sunday Post delivered as a digital ePaper straight to your smartphone, tablet or computer.
Subscribe for only £5.49 a month and enjoy all the benefits of the printed paper as a digital replica.
Subscribe