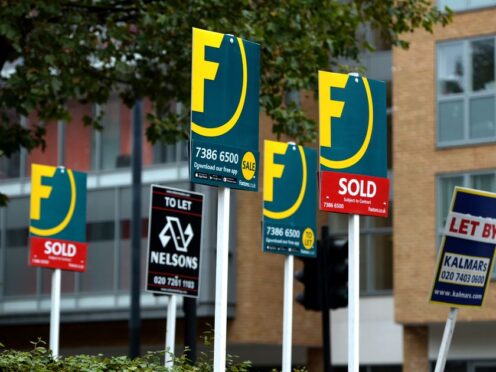
The average UK house price fell by 0.2% month on month in March, although there are signs that activity is picking up, according to a report.
Property values increased by 1.6% annually, taking the average UK house price to £261,142, Nationwide Building Society said.
Robert Gardner, Nationwide’s chief economist, said: “Activity has picked up from the weak levels prevailing towards the end of 2023 but remains relatively subdued by historic standards.
“For example, the number of mortgages approved for house purchase in January was around 15% below pre-pandemic levels.
“This largely reflects the impact of higher interest rates on affordability. While mortgage rates are below the peaks seen in mid-2023, they remain well above the lows prevailing in the wake of the pandemic.”

Mr Gardner pointed to signs that consumer sentiment is improving.
He said: “Indeed, surveyors report a pick-up in new buyer inquiries and new instructions to sell in recent months. Moreover, with income growth continuing to outpace house price growth by a healthy margin, housing affordability is improving, albeit gradually.
“If these trends are maintained, activity is likely to gain momentum, though the pace of the recovery is still likely to be heavily influenced by the trajectory of interest rates.”
The index also included data for the UK’s nations and regions, showing annual changes during the three months to March.
The figures showed that within England there was a split, with house prices generally increasing in northern regions and falling in the South.
Mr Gardner said: “Across northern England (including the North East, North West, Yorkshire and the Humber, East Midlands and West Midlands), prices were up 1.7% year on year.
“Meanwhile, southern England (including the South West, Outer South East, Outer Metropolitan, London and East Anglia) saw a 0.3% year-on-year fall.
“London remained the best-performing southern region, with annual price growth recovering to 1.6%. The South West was the weakest performing region, with prices down 1.7% year on year.”
Mr Gardner said Northern Ireland remained the best-performing area, with prices up by 4.6% compared with the first quarter of 2023.
Rob Wood, chief UK economist at Pantheon Macroeconomics, described the month-on-month fall in house prices as a “blip”.
He said: “Forward-looking indicators continue to suggest house prices will keep rising as mortgage rates gradually tick down…
“We continue to expect house prices to rise 4% year over year in 2024.”
David Hollingworth, associate director, communications at L&C Mortgages, said: “Interest rates have understandably been at the heart of the subdued housing market in the face of periods of extreme volatility and higher cost of living.
“Mortgage rates have dropped substantially, and the lowest five-year fixed rates now sit around one percentage point lower than last summer.”
Martin Beck, chief economic adviser to the EY Item Club, said: “The EY Item Club thinks the fall in house prices in March will prove only a temporary interruption to a gradual rebound in property values.
“Falling inflation and still-strong pay growth mean real wages are rising again, while unemployment is very low, consumer sentiment has picked up and quoted mortgage rates are significantly down on the peaks of summer 2023.”
Jonathan Hopper, chief executive of Garrington Property Finders, said: “Price rises are still being tempered by the high cost of borrowing.”
Anna Clare Harper, chief executive of investment adviser GreenResi, said: “The housing market is not one single market – it’s millions of tiny locations down to the street level, each becoming more or less popular over time, influenced by different factors ranging from local authority solvency to new local development schemes.”
Tom Bill, head of UK residential research at estate agent Knight Frank, said: “House prices have risen marginally but the direction of travel for the UK market has been sideways so far this year.
“Demand will be unleashed once there is a more permanent drop in mortgage rates and that requires fewer mixed signals around inflation and a rate cut to appear firmly on the horizon.”
Nicky Stevenson, managing director at estate agent group Fine & Country, said: “Sellers still need to price sensibly to attract attention, as buyers know they are in a strong negotiating position.”
Iain McKenzie, chief executive of the Guild of Property Professionals, said: “As prices stabilise and even grow in some parts of the country, we expect to see the demand grow too, especially with more attractive mortgage products now being offered.”
Matt Thompson, head of sales at London-based estate agent Chestertons, said: “March concluded the first quarter of the year with a busy property market.”
Nathan Emerson, chief executive of Propertymark, said sellers have “every reason to start feeling positive about putting their home up for sale”.
Here are average house prices and the annual house price change, according to Nationwide (the annual change figures compare the three months to March with a year earlier):
Northern Ireland, £181,303, 4.6%
North East, £158,543, 4.1%
Scotland, £179,148, 3.7%
North West, £209,548,2.9%
Yorkshire and the Humber, £200,958, 2.4%
London, £519,505, 1.6%
Wales, £202,533, 1.2%
East Midlands, £229,458, 0.5%
West Midlands, £236,006, minus 0.2%
Outer Metropolitan (includes parts of Buckinghamshire, Hertfordshire and Surrey), £414,477, minus 0.6%
Outer South East (includes parts of Bedfordshire, Oxfordshire and East Sussex), £328,544, minus 1.0%
East Anglia, £268,778, minus 1.3%
South West, £297,228, minus 1.7%
Enjoy the convenience of having The Sunday Post delivered as a digital ePaper straight to your smartphone, tablet or computer.
Subscribe for only £5.49 a month and enjoy all the benefits of the printed paper as a digital replica.
Subscribe