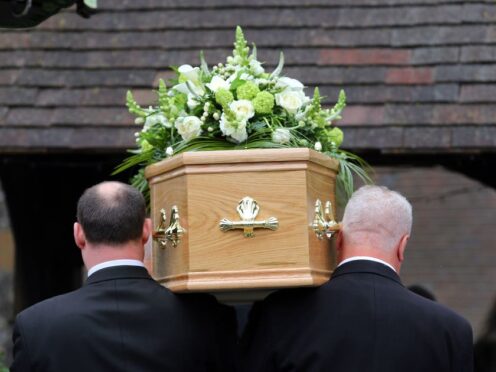
A new method of calculating the number of excess deaths in the UK has produced a much lower figure for 2023 than previously estimated.
Excess deaths are the number of deaths above what would be expected in a normal year and can show the impact on the public of health emergencies, such as periods of extreme weather or outbreaks of viruses like flu and Covid-19.
The figures have traditionally been estimated by comparing the number of deaths in a particular period with the average number of deaths in the same period in previous years.
But a new method that better reflects the growth and ageing of the population has been launched by the Office for National Statistics (ONS), in partnership with health and statistical agencies across the country.
Under the new calculations, there were an estimated 10,994 excess deaths in the UK in 2023 – around a third of the total using the traditional method, which was 31,442.

Estimates for the first two years of the Covid-19 pandemic show less of a difference, with 76,412 in 2020 under the new method compared with 84,064 using traditional calculations, and 55,079 for 2021 compared with 61,907.
The new estimate for 2022, 43,456, is slightly higher than the previous estimate of 38,960.
The contrast between the sets of figures, particularly the sharp difference in the numbers for 2023, shows how estimates of excess deaths can change when adjusted for trends in population size, age structure and mortality rates.
The traditional method did not reflect any of these factors and instead used a simple five-year average to estimate the number of expected deaths.
Julie Stanborough, ONS deputy director for health data & analysis, said the “weakness” of the traditional approach was that it did not take into account the ageing and growing population of the UK, where “all else being equal, more people means more deaths, particularly if a greater share of the population are elderly”.
This approach also failed to reflect trends in population mortality rates, “which were generally falling until 2011 before levelling off until the onset of the pandemic”.
The new method uses statistical models to calculate the expected number of deaths in each period – an approach that “moves away from averages drawn from raw numbers and instead uses age-specific mortality rates,” she added.
“This means when we ask that first question – how many deaths would we expect there to be? – we take into account how the population has grown and aged over time.”
We've led the development of a new method for estimating the number of excess deaths across UK countries.
Julie Stanborough talks us through the data released today and how this new method will give us a better understanding in this complex area ➡️ https://t.co/RnY81qjxtp pic.twitter.com/uJPB3r5G2s
— Office for National Statistics (ONS) (@ONS) February 20, 2024
The new model also reflects trends and seasonality in population mortality rates and allows for estimates of excess deaths to be broken down by age group, sex and nations and regions.
The highest number of excess deaths estimated by the new method over the nine years before the pandemic was 30,858 in 2015.
This is below the new estimates for each of the three years from 2020-22, but some way above the 10,994 excess deaths estimated for 2023.
Both the traditional and new methods of estimating excess deaths show weekly peaks that coincide with the first two waves of the Covid-19 pandemic, which hit the UK in the spring of 2020 and the winter of 2020/21.
But estimates from the new method are generally lower than those from the traditional method throughout 2023 – and by an increasing amount.
For example, under the original method, there were excess deaths in nine of the last 10 weeks of 2023, the exception being the final week.
But the new method estimates no excess deaths in any of these weeks.

The ONS’ Daniel Ayoubkhani said: “Using our new methodology, today’s release shows tragically there were an estimated 11,000 excess deaths in 2023.
“Looking more closely at the last months of 2023, there were actually negative excess deaths, meaning fewer deaths than average being registered.
“Different organisations have used different ways to calculate excess deaths – each with merit and particular uses, for example for planning health interventions and identifying emerging threats.
“In the spirit of continuous improvement, we’ve been working with independent experts, and those across government and the devolved nations, to develop a common UK-wide approach.”
Expected number of deaths used to calculate excess mortality is now estimated from age-specific mortality rates rather than death counts, so changes in population size and age structure are taken into account. Our new method also accounts for trends in population mortality rates.
— Office for National Statistics (ONS) (@ONS) February 20, 2024
Along with adjustments for population size, ageing and mortality rates, a further change to the way excess deaths are calculated has had a particular impact on the sharp difference between the new and previous estimates for 2023.
In the traditional method, 2020 – the first year of the Covid-19 pandemic – was excluded from subsequent comparisons, to avoid distortion due to the extremely high number of registered deaths.
This meant that the five-year average used for estimating excess deaths in 2022 was 2016-19 plus 2021, while in 2023 it was 2017-19 plus 2021-22.
The new approach is more precise in the way it treats Covid-19, removing from its comparisons the individual months that coincided with the peaks of the first wave (March and April 2020) and second wave (November 2020 to February 2021), rather than omitting the whole of 2020.
This change has made a “notable contribution” to the new estimates for both 2022 and 2023, the ONS said.
The new method does not for the moment provide a breakdown of the causes of death that might be driving the trends in the figures.
The ONS has indicated it intends to add this information to its estimates in the future, however.
Enjoy the convenience of having The Sunday Post delivered as a digital ePaper straight to your smartphone, tablet or computer.
Subscribe for only £5.49 a month and enjoy all the benefits of the printed paper as a digital replica.
Subscribe