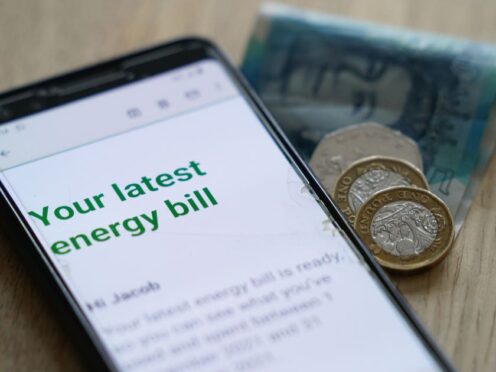
The average household energy bill will fall to its lowest point in two years from Monday after Ofgem lowered its price cap in response to wholesale prices.
In some long-awaited good news for energy customers, the regulator’s price cap has dropped by 12.3% from the previous £1,928 for a typical dual fuel household in England, Scotland and Wales to £1,690, a fall of £238 over the course of a year or about £20 a month.
The average household on a standard variable tariff (SVT) is expected to spend £127 on energy in April, compared with £205 in March, due to a combination of cheaper rates and lower usage as the weather warms up.
Some 10 million households who are on SVTs and do not have a smart meter have been urged to send meter readings to their supplier as soon as possible to ensure they are charged at the cheaper rate.
Suppliers who have not received meter readings base their bills on estimated usage, meaning households could be overpaying, while others may not be paying enough.
The difference between a week’s worth of energy at the old rates compared with a week in April was £4.65 for the average household, Uswitch warned.
Nearly a fifth of households who do not have a smart meter (18%) have not submitted their meter readings in the last three months, and 4% have not done so for a whole year, a survey for the comparison site found.
Ofgem said the price cap drop would see energy prices reach their lowest level since Russia’s invasion of Ukraine in February 2022, which caused a spike in an already turbulent wholesale energy market, driving up costs for suppliers and customers.
However, the regulator has also allowed a temporary additional payment of £28 a year, or £2.33 a month, to make sure suppliers have enough funds to support customers who are struggling.
This will be added to the bills of customers who pay by direct debit or standard credit and is to be partly offset by the end of an allowance worth £11 per year that covered debt costs related to the Covid pandemic.
Prepayment meter customers will not have to pay the extra charge, as many do not build up the same level of debt as credit customers because they top up as they go, Ofgem said.
The regulator also confirmed plans to set a permanent solution to prepayment customers paying higher standing charges, which was removed by the Government’s temporary Energy Price Guarantee.

Ofgem said the solution must be funded by bill-payers rather than taxpayers, to maintain fairness, meaning prepayment customers will save about £49 per year while direct debit customers will pay £10 more each year.
Campaigners warned that while the costs that households pay for every unit of energy they use will decrease “slightly”, they were still almost double what they were in 2021.
Meanwhile, standing charges – the fixed daily amount households pay to have energy supplied to their property, no matter how much they use – have gone up as of today.
For gas, standing charges have risen from the average 29.6p to an average 31.43p a day, while the daily standing charge for electricity has gone up from 53.35p a day to 60.1p a day.
This means that for the average direct debit customer, a total energy bill’s standing charges will rise from £303 a year to £334.
It is also important to note that the price cap is not a limit on the overall amount people will pay for their energy, but instead caps the amount that they pay per kilowatt hour, or unit, of gas and electricity.
Simon Francis, co-ordinator of the End Fuel Poverty Coalition, said: “As standing charges go up, households have to cut back on their energy use just to keep their bills the same.
“This means households continue to struggle to keep themselves warm, keep the lights on and put food on the table.”
Warm This Winter spokeswoman, Fiona Waters, said: “The issue with standing charges is that you have to pay it whether you’ve used any energy or not and it continues to rise even now when the overall price cap has reduced.
“There’s also a huge question mark over what it covers and how much profit is being made by these network firms.
“When there is already so much energy debt and people are still paying much more on their bills than they did three years ago, it’s clear we need to fix our broken energy system.
“This can be done by expanding homegrown renewable energy and a mass programme of insulation to bring down energy bills for good.”
Enjoy the convenience of having The Sunday Post delivered as a digital ePaper straight to your smartphone, tablet or computer.
Subscribe for only £5.49 a month and enjoy all the benefits of the printed paper as a digital replica.
Subscribe