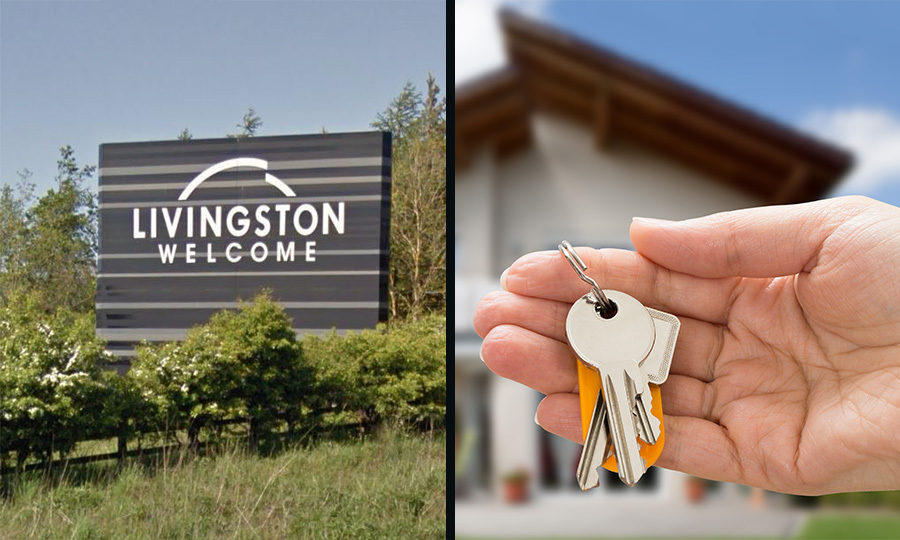
LIVINGSTON, Bristol and Sudbury in Suffolk have all been identified as top property hotspots in 2017.
Rightmove said Bristol was the most searched-for place outside London this year for both buyers and renters.
Meanwhile, house asking prices in Sudbury have surged by 13.1% over the past year – more than anywhere else in Britain – according to the information taken from Rightmove’s website.
And homes in Livingston are the fastest to sell typically – flying off the shelves in just 23 days – around a third of the national average selling time of 67 days.
Miles Shipside, director of Rightmove, said: “Although prices have grown at a muted rate of 1.2% nationally this year, there are a number of local markets where strong demand and short supply has led to pretty heady price rises, especially in areas where homes are relatively more affordable than some of their nearby cities.”
Rightmove also quoted the views of estate agents in its report.
Dan Gurney, area manager at William H Brown Estate Agents in Sudbury, said of the area: “It’s a thriving market town with picturesque countryside on its doorstep so, all combined, it’s no surprise that it tops the table for price growth.
“Sudbury is a property hotspot for those buyers attracted to its close proximity to Cambridge and range of Georgian and Victorian properties, plus we’ve seen a wave of buyers from London – it has certainly benefited from a ‘ripple out’ effect where buyers look for more for their money away from climbing city house prices.”
And referring to the popularity of Bristol, Sam Riddell, senior branch manager of Andrews Property Group in Bishopston, said: “Bristol has something for everyone, from the bohemian streets of St Werburghs to the grandeur of Clifton Village.”
Two places in West Yorkshire make the top 10 places with the biggest asking price rises in 2017 – Sowerby Bridge and Todmorden – and two in Northamptonshire – Rushden and Kettering.
Stephen Revell, branch manager at William H Brown Estate Agents in Sowerby Bridge, located near to trendy Hebden Bridge, said: “Buyers are certainly cottoning on to the fact that, in this location, you get a lot more property for your money.”
Meanwhile, Simon Thomas, owner of RE/MAX Estate Agents in Livingston, said: “Supply has been quite tight which has led to buyers finding themselves up against a lot of competition to secure the home they want, which has led to properties selling more quickly than before.”
London was excluded from all of the findings in Rightmove’s report.
Here are the top 10 places in Britain for asking price growth according to Rightmove, with the average asking price and the annual percentage increase:
1. Sudbury, Suffolk £265,291, 13.1%
2. Sowerby Bridge, West Yorkshire, £191,716, 12.5%
3. Kendal, Cumbria, £226,163, 10%
=4. Burnham-On-Sea, Somerset, £235,083, 9.9%
=4. Todmorden, West Yorkshire, £193,408, 9.9%
=6. Havant, Hampshire, £254,379, 9.7%
=6. Rushden, Northamptonshire, £227,534, 9.7%
=6. Kettering, Northamptonshire, £198,354, 9.7%
9. West Bromwich, West Midlands, £149,360, 9.5%
10. March, Cambridgeshire, £210,157, 9.4%
Here are the top 10 places where homes have been selling the quickest according to Rightmove, with the average number of days to sell and the average asking price:
1. Livingston, West Lothian, 23, £147,588
2. Edinburgh, 34, £242,223
=3. Corby, Northamptonshire, 35, £173,720
=3. Kettering, Northamptonshire, 35, £198,354
=3. Coventry, West Midlands, 35, £201,971
=6. Falkirk, Stirlingshire, 36, £127,553
=6. Glasgow, 36, £150,388
=6. Rugby, Warwickshire, 36, £223,799
=9. Aldershot, Hampshire, 37, £279,343
=9. Gillingham, Kent, 37, £272,995
And here are the top 10 buyer searches on Rightmove’s website in 2017 followed by the top 10 rental searches outside London:
1. Bristol, Bristol
2. York, Birmingham
3. Norwich, Leeds
4. Edinburgh, Manchester
5. Sheffield, Nottingham
6. Birmingham, Liverpool
7. Cambridge, Glasgow
8. Bournemouth, Cambridge
9. Manchester, Bournemouth
10. Nottingham, Sheffield
Enjoy the convenience of having The Sunday Post delivered as a digital ePaper straight to your smartphone, tablet or computer.
Subscribe for only £5.49 a month and enjoy all the benefits of the printed paper as a digital replica.
Subscribe