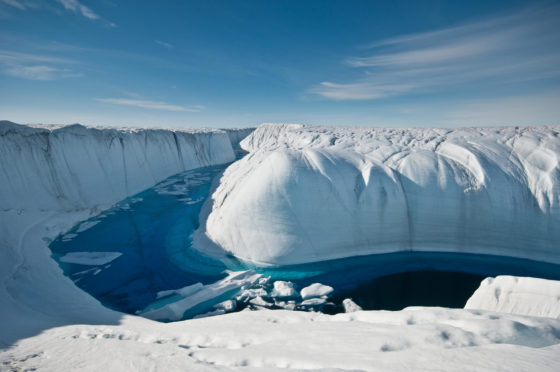
The annual ice mass loss from Greenland in 2019 broke the previous record melt in 2012 by 15%, a new study suggests.
But melting in the two-year period of 2017 and 2018 was reduced compared to any other two-year period between 2003 and 2019.
The Greenland Ice Sheet is one of the largest contributors to sea level rise, and is associated with about 0.76mm per year, out of the total of about 3.5mm per year rise in global mean sea level from 2005 to 2017, researchers say.
Using the satellite missions Grace (Gravity Recovery and Climate Experiment) and its follow-on mission Grace-FO, experts have been able to quantify ice mass loss by tracking changes in gravity.
Ingo Sasgen from the Alfred Wegener Institute Helmholtz Centre for Polar and Marine Research and colleagues analysed data from the two satellite missions from 2003 to 2019.
They detected unusually low melt in 2017 and 2018, followed by record-high melt in 2019 of approximately 532 gigatonnes.
In 2012 the melt was around 464 gigatonnes, researchers say.
Using simulations with a regional climate model, the authors suggest the low melt in 2017-2018 could have been due to cold summers in western Greenland and high snowfall in the East.
Writing in a paper published in Communications Earth & Environment, the authors say: “The time series of Grace/Grace-FO GrIS mass anomalies documents an abrupt transition from a reduced rate of mass loss in 2017-2018 (58% lower than 2003-2018 average) to a strongly enhanced rate of mass loss in 2019 (July mass loss rate 51% above 2003-2016 average).
“A similar but inverse transition occurred between the record melt year of 2012 and the near-balance year of 2013.”
They add that the data reveals that the satellites show the annual balance of melt in 2019 exceeded the previous record loss measured by Grace in 2012.
The researchers say “2019 exhibited the largest mass loss on record”, following a trajectory of increasing ice loss since the late 1990s.
In an accompanying News and Views article in Nature Climate Change, Yara Mohajerani, from the department of earth system science at University of California Irvine, said: “It is crucial to understand and closely monitor the changes in mass balance of the Greenland Ice Sheet.
“Sasgen and colleagues take an important step in that direction.”
Professor Ed Hawkins, climate research scientist at the University of Reading, said: “To put this 2019 Greenland melt rate into context, 532 gigatonnes in one year is equivalent to around six Olympic-sized swimming pools every single second of the year.”
Dr Twila Moon, a research scientist at the University of Colorado at Boulder, said: “It is devastating that 2019 was another record year of ice loss.
“In 2012, it had been about 150 years since the ice sheet had experienced similar melt extent, and then a further 600-plus years back to find another similar event.
“We have now had record breaking ice loss twice in less than 10 years, and the ice sheet has lost ice every year for the past 20.
“The research further confirms that we are in a dire state of ice loss in Greenland. This ice loss translates directly to rising seas around the world.”

Enjoy the convenience of having The Sunday Post delivered as a digital ePaper straight to your smartphone, tablet or computer.
Subscribe for only £5.49 a month and enjoy all the benefits of the printed paper as a digital replica.
Subscribe