Poorest areas paying £1,000 more than those in affluent London.
Struggling families in the north of England are paying up to £1,000 more council tax than the most affluent areas of London.
Local authorities are currently announcing their council tax rates for the next 12 months with an average rise of 0.6% expected.
But a Sunday Post probe has revealed a huge disparity between affluent areas of London, which enjoy the lowest council tax rates in the country, and swathes of the north of England which pay more than double.
During 2013-14 residents in Westminster who have an average salary of £46,316, paid just £681 council tax for a Band D home, making it the cheapest in England.
And the Top 10 cheapest council tax boroughs in the country are dominated by London, with the Isles of Scilly the only non-London borough on the list.
The most expensive bills are to be found in less affluent regions including north east England, where families are paying up to £1,000 more than the capital.
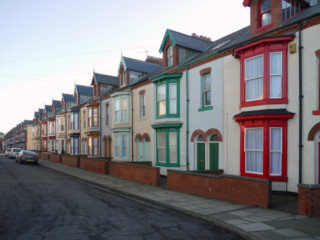
In Hartlepool which has an average wage of £23,962, Band D homes cost £1,685 £1,000 more than Westminster, £994 more than Wandsworth, £742 more than City of London, £624 more than Hammersmith and Fulham and £600 more than Kensington and Chelsea.
Neighbouring Redcar and Cleveland, whose residents earn £21,288 on average, charges £1,644.40 which made it the ninth most expensive in England.
Labour MP Iain Wright, who represents Hartlepool, said poorer areas have greater demand on expensive services, and fewer people able to pay for them.
He said: “People are struggling with bills rising faster than wages and council tax can be a massive part of their expenditure. So local authorities must make sure they give value for money.
“In deprived places, there is much more demand on services, there are more older people, more issues with mental health and other issues which cost money. And the ability to draw revenue to fund that is made more difficult.
“My area has had the highest funding cut per head in the country by this coalition.”
Mr Wright added that more than half of the residents in Hartlepool live in the cheapest Band A homes, compared with affluent areas like Westminster which are dominated by high band homes.
Beth Farhat secretary of the Trades Union Congress northern region, claimed the gap between rich and poor is set to increase.
She said: “The revenue support grant should be fairer to local authorities in the north, and sufficient to ensure all local authorities are properly funded.
“Cutting the money that goes to councils can drag the local economy down, through reduced council spending and employees simply having less money in their pockets.
“When the council tax was introduced, we said it was regressive as it did not have enough bands. Equally, the tax isn’t proportionate even to property values.
“A Band H property will pay at most three times more than a Band A, even though the value of the property may be 10 or more times higher. We therefore call for there to be more bands above H so owners of very expensive properties pay more.”
Hartlepool Council said 56% of the homes in its borough are in Band A, compared with just 1.4% in Westminster which has a significant amount of high-banded homes. A spokesman said the higher bills were further mitigated by the number of people receiving benefits.
A Department of Communities and Local Government spokesperson said: “Council funding is fair to all parts of the country rural or urban, district or county, city or shire meaning councils can deliver sensible savings while protecting frontline services.
“As more affluent areas have more homes in higher council tax bands, they pay higher average council tax.
“There is more councils can do to reduce the cost to the taxpayer such as recover the £2 billion a year of uncollected council tax, reduce the £2 billion lost to fraud and error, utilise the £16 billion sitting in reserves and make better use of councils’ multi-billion pound property assets.”
“While council tax levels remain a local decision, this Government has worked with councils to freeze council tax over the last three years, cutting bills by more than 10% in real terms and giving families greater financial security.”
Related stories

Enjoy the convenience of having The Sunday Post delivered as a digital ePaper straight to your smartphone, tablet or computer.
Subscribe for only £5.49 a month and enjoy all the benefits of the printed paper as a digital replica.
Subscribe