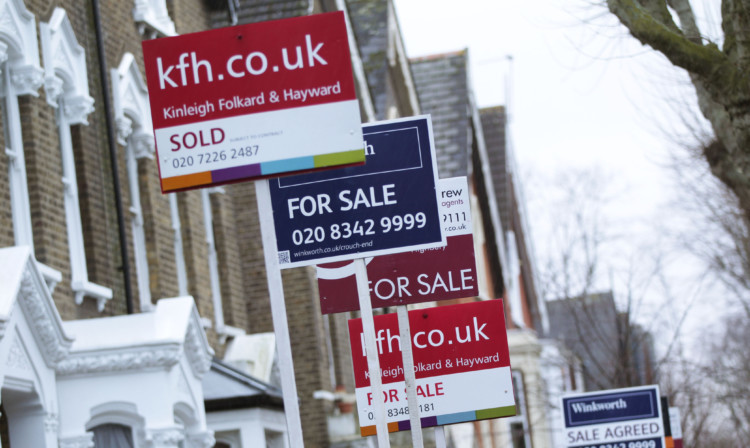
The number of existing home owners moving house in the first half of the year has reached its highest level since 2008, a report found.
There were 174,700 home movers in the first half of 2016, marking a 9% increase compared with the same period a year earlier, according to calculations from Lloyds Bank.
Lloyds said this was the highest level for any January to June period since 2008, when there were 179,800 home movers in the first half of that year.
The research also suggests it has become easier for some home movers to take their second step on the property ladder and upgrade from the first home they ever bought.
Lloyds said affordability of “second stepper homes” has improved in recent years, as the rising value of a starter home has given home owners bigger deposits to use as a springboard for their next property.
Its figures showed there were 12% more first-time buyers in the market in the first half of this year than a year earlier, meaning some second steppers might have found it easier to sell their starter home, with more potential buyers in the market.
Housing affordability for second steppers was calculated as the average price they can expect to pay for a home minus the amount they have to put down as a deposit, as a ratio of average annual earnings.
Lloyds found second steppers needed to find 6.5 times their earnings to move up the property ladder in June, marking an improvement from 2011 when they needed to find 7.3 times their earnings.
Andrew Mason, Lloyds Bank mortgage product director, said higher house prices have boosted the amount of cash home movers have in their property, which in turn has helped towards the purchase of the next home.
He said: “This improvement is likely to have provided uplift to housing demand amongst existing home owners even though wage growth has not kept pace during this period.”
He said stamp duty changes announced in 2014, which made the tax cheaper for many home movers, had also helped to support the market.
But not all parts of the UK have seen housing affordability improve for second steppers, with London and the South East of England having seen property values generally rising steeply in recent years.
In London, someone trying to climb onto the second rung of the property ladder needs to find around 10.9 times their earnings, up from 9.7 times their wages five years ago.
In the South East, a second stepper typically needs to find 9.4 times their wages, up from a multiple of 8.7 in 2011.
By contrast, a second stepper in Northern Ireland needs to find 4.9 times their wages typically, down from 6.2 in 2011.
A second stepper in Scotland needs to find around 5.6 times their wages, down from 6.6 times five years ago, while a second stepper in Wales needs 6.2 times their wages, down from seven times their wages in 2011.
With house prices in many parts of the UK having increased strongly in recent years, Lloyds also found a growing trend towards longer-term mortgages as home movers look to spread the costs.
Five years ago, fewer than one in 10 (9%) home movers took out mortgages lasting 25 to 35 years, but now this has doubled to nearly one in five (18%) home movers doing so.
In the past year alone, the average price paid for a home by a home mover has increased by 9%, or £24,056, to £285,606.
The average deposit being put down by a home mover has increased by nearly a third (32%) over the past five years and now stands just shy of £100,000 – at £95,385.
Home movers in London typically put down the largest deposit towards the purchase of their next home, at £192,133, while movers in Northern Ireland put down the smallest deposits on average, at £42,310.
Lloyds used house price figures from its banking group’s database to make the findings, as well as average earnings data from the Office for National Statistics and figures from the Council of Mortgage Lenders.
Here are the average prices paid for a property by home movers in 2016, followed by the average deposit they are putting down and the deposit as a percentage of the purchase price, and the percentage change in the deposit size over the last five years, according to Lloyds Bank:
Scotland, £201,470, £60,911, 30%, 7%
North East, £183,933, £52,353, 28%, 12%
Yorkshire and the Humber, £207,118, £64,689, 31%, 24%
North West, £212,724, £62,796, 30%, 23%
East Midlands, £219,018, £69,128, 32%, 29%
West Midlands, £233,910, £73,702, 32%, 30%
East Anglia, £265,249, £92,593, 35%, 25%
Wales, £197,066, £61,696, 31%, 21%
South West, £278,783, £99,648, 36%, 12%
South East, £382,324, £135,149, 35%, 39%
London, £540,440, £192,133, 36%, 57%
Northern Ireland, £159,326, £42,310, 27%, minus 17%
READ MORE
Home owners decline to save for their next properties as prices rise, says study
Enjoy the convenience of having The Sunday Post delivered as a digital ePaper straight to your smartphone, tablet or computer.
Subscribe for only £5.49 a month and enjoy all the benefits of the printed paper as a digital replica.
Subscribe