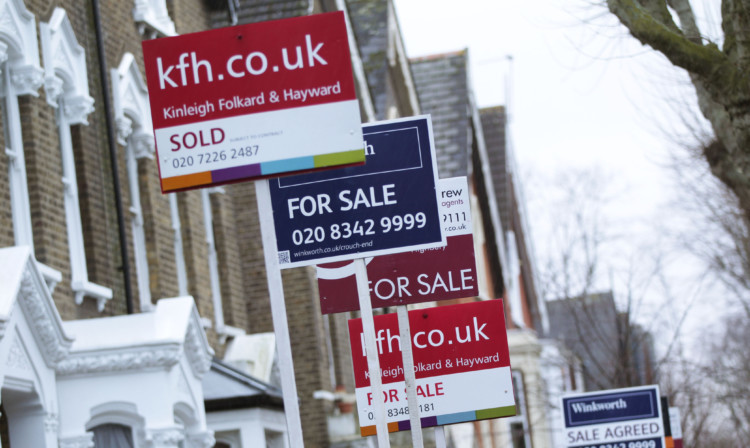
ACCORDING to new research, Green Party and Liberal Democrat constituencies are the most expensive areas of the UK.
Conservative seats only rank third in the study linking house prices to political party support.
The findings from Bridging Loan Hub reveal that, when analysing the average house price in all 650 UK constituencies, at £394,577 the sole Green constituency (Brighton, Pavilion) pips the Lib Dems, with an average value of £368,517.
Despite a reputation for ‘looking after the rich’ Conservative seats are only the third most expensive in Britain, averaging £330,585 per home.
The most expensive single constituency, however, is a Tory one, with four others making up the top 10.
Chelsea and Fulham has an average house value of £2,203,482, which is 25 times more than the cheapest constituency in the UK
Political parties ranked by average constituency house price:
- Green – £394,577
- Liberal Democrat – £368,517
- Conservative – £330,585
- Labour – £265,762
- Independent – £198,912
- SNP – £170,920
- Plaid Cymru – £168,449
- DUP – £141,926
- Sinn Féin – £133,820
Conservative seats also have the greatest range in house prices. The difference between the most and least expensive Tory constituencies is £2,082,689 and Labour follow closely behind with a £2,014,780 difference.
Seats held by Jeremy Corbyn’s party have £265,762 homes on average, with constituencies ranging from £90,058 to £2,104,838.
Sinn Féin strongholds in Northern Ireland have the cheapest homes nationally, averaging just £133,820 per property across their seven seats. The Irish republican party also has the lowest price for any single constituency: £88,178 in West Tyrone.
The 10 most expensive constituencies:
- Chelsea and Fulham (CON) – £2,203,482
- Kensington (LAB) – £2,104,838
- Hampstead and Kilburn (LAB) – £1,628,737
- Cities of London and Westminster (CON) – £1,390,934
- Westminster North (LAB) – £1,203,319
- Beaconsfield (CON) – £1,150,489
- Esher and Walton (CON) – £1,070,797
- Hammersmith (LAB) – £1,034,910
- Holborn and St Pancras (LAB) – £946,475
- Richmond Park (CON) – £932,113
Daniel Tannenbaum of Bridging Loan Hub said: “It is interesting that our findings reveal that the more liberal parties have supporters who own the most expensive properties on average, potentially dispelling some Tory stereotypes.
“The split of the richest 10 constituencies is exactly 50:50 between Conservative and Labour, so there is no evidence here that one party is the ‘party of the rich’. The wide range of house prices for both parties’ constituencies suggest their policies are in fact appealing to a wide range of people all across Britain.”
| Party | Average house price | Max. average constituency price | Min. average constituency price | Range |
| Green | £394,577 | £394,577 | £394,577 | No range |
| Liberal Democrat | £368,517 | £770,679 | £110,688 | £659,991 |
| Conservative | £330,585 | £2,203,482 | £120,793 | £2,082,689 |
| Labour | £265,762 | £2,104,838 | £90,058 | £2,014,780 |
| Independent | £198,912 | £198,912 | £198,912 | No range |
| SNP | £170,920 | £274,856 | £114,789 | £160,067 |
| Plaid Cymru | £168,449 | £202,356 | £108,534 | £93,822 |
| DUP | £141,926 | £221,853 | £113,638 | £108,215 |
| Sinn Féin | £133,820 | £198,912 | £88,178 | £110,734 |
Enjoy the convenience of having The Sunday Post delivered as a digital ePaper straight to your smartphone, tablet or computer.
Subscribe for only £5.49 a month and enjoy all the benefits of the printed paper as a digital replica.
Subscribe