COMMUTERS on buses and trains are being exposed to higher levels of air pollution than walkers and cyclists, Sunday Post research can reveal.
We fitted people with pollution monitors to use on six different modes of transport to highlight our exposure to the fine sooty particles which are linked to thousands of premature deaths every year.
The survey shows those on foot and bikes enjoy much cleaner air but exposure to pollution rockets at junctions or in traffic.
Elsewhere, motorists – one of the biggest causes of air pollution – face modest levels, while train and bus passengers face more than twice as much pollutants as those walking or cycling.
Campaigners said the findings “give compelling evidence for the need for action on traffic” in the face of more than 2000 air pollution deaths in Scotland every year.
Emilia Hanna, an air pollution campaigner for Friends of the Earth Scotland, said: “These results show that the daily commute is a toxic experience for many people.
“All the monitors recorded levels of harmful particulate matter, which increases risk of heart attacks and strokes.
“Long-term exposure to particulate matter can also cause babies to be born with low birth weights and is nearly as bad for unborn babies as smoking during pregnancy.
“Traffic is the key cause of outdoor air pollution, and that is plain to see from the cyclist’s results. The cyclist was exposed to much higher levels when she was cycling on Dumbarton Road, and as soon as she went into Kelvingrove Park, the levels plummeted.
“The results give compelling evidence for the need for urgent action on traffic.”
Our experiment took place in Glasgow last month with volunteers taking pollution monitors on to six modes of transport.
The monitors – which take readings every 10 seconds – measured, often invisible, particles in the air smaller than 2.5 microns (one thousandth of a millimetre) across, known as PM2.5s.
The particles come from road traffic include soot from engines, dust from car brakes as well as dust from road surfaces.
The World Health Organisation (WHO) “safe” limit for PM2.5 is exposure to an average of 25 micrograms of the particles per cubic metre of air in a 24-hour period.
Dr Sean Semple, a leading air pollution expert from the University of Aberdeen, said: “These results show that our exposure to fine particulate matter varies as we move around a city.
“Our exposure is also generally much higher when we are within enclosed spaces than outside, so for example we see higher levels in the subway, trains, cars and buses compared to those measured while walking and cycling.
“Commuting by walking and cycling on the day measured produced the lowest exposures to PM2.5 and clearly such modes of transport have positive health benefits both directly for the individual and for society in reducing the PM2.5 emissions from car use.”
‘It’s frustrating not being able to spend time outdoors with my grandkids’
The results for a journey on Glasgow’s Subway, from Partick to the St Enoch, showed individual readings as high as 360 micrograms with a median rate of 311.5.
The journey only lasted 10 minutes but figures from subway operator Strathclyde Passenger Transport (SPT) released last month showed high pollution rates over a longer period.
At Partick station, the 24-hour average PM2.5 reading was at 182 micrograms – higher than the WHO’s recommended 25 micrograms.
Pollution expert Dr Semple, who holds an honorary senior scientist position at the Institute of Occupational Medicine – which supplied our monitoring equipment – said: “While the subway values stand out, it is worth emphasising that the particulate in the underground setting is likely to be of a different composition to that measured at street level.
“The scientific thinking is that likely health effects from breathing this type of PM is almost much less harmful than the particulate we experience from diesel and petrol cars in streets above the ground.”
A spokesperson for SPT said: “SPT regularly undertakes independent surveys to assess air on the Subway system and these surveys consistently show the risk to human health is low given the air pollution levels found in the Subway and limited duration of exposure, given the very short journey times.”
Last week the WHO ranked Glasgow as one of the most polluted parts of the UK. The WHO tested 51 towns and cities for PM2.5 and found Glasgow had 16 micrograms of the particles per cubic metre of air, exceeding the 10 micrograms safe limit.
Glasgow is set to be the first place in Scotland with a low emission zone which will come in next year and introduce curbs on polluting vehicles.
A Scottish Government spokesman said: “Scotland is the first country in Europe to pass legislation based on WHO guidelines for fine particulate matter PM2.5, and our Cleaner Air for Scotland strategy sets out a programme of action to promote air quality.
“We will work with local authorities to introduce low emission zones in each of our four biggest cities by 2020 and in all other Air Quality Management Areas where necessary by 2023.
“Our aim is for new petrol and diesel cars and vans to be phased out in Scotland by 2032.”
How our team hit the streets and stations to measure the problem
Our commuters made their way from the Partick area of Glasgow to St Enoch Square in the city centre.
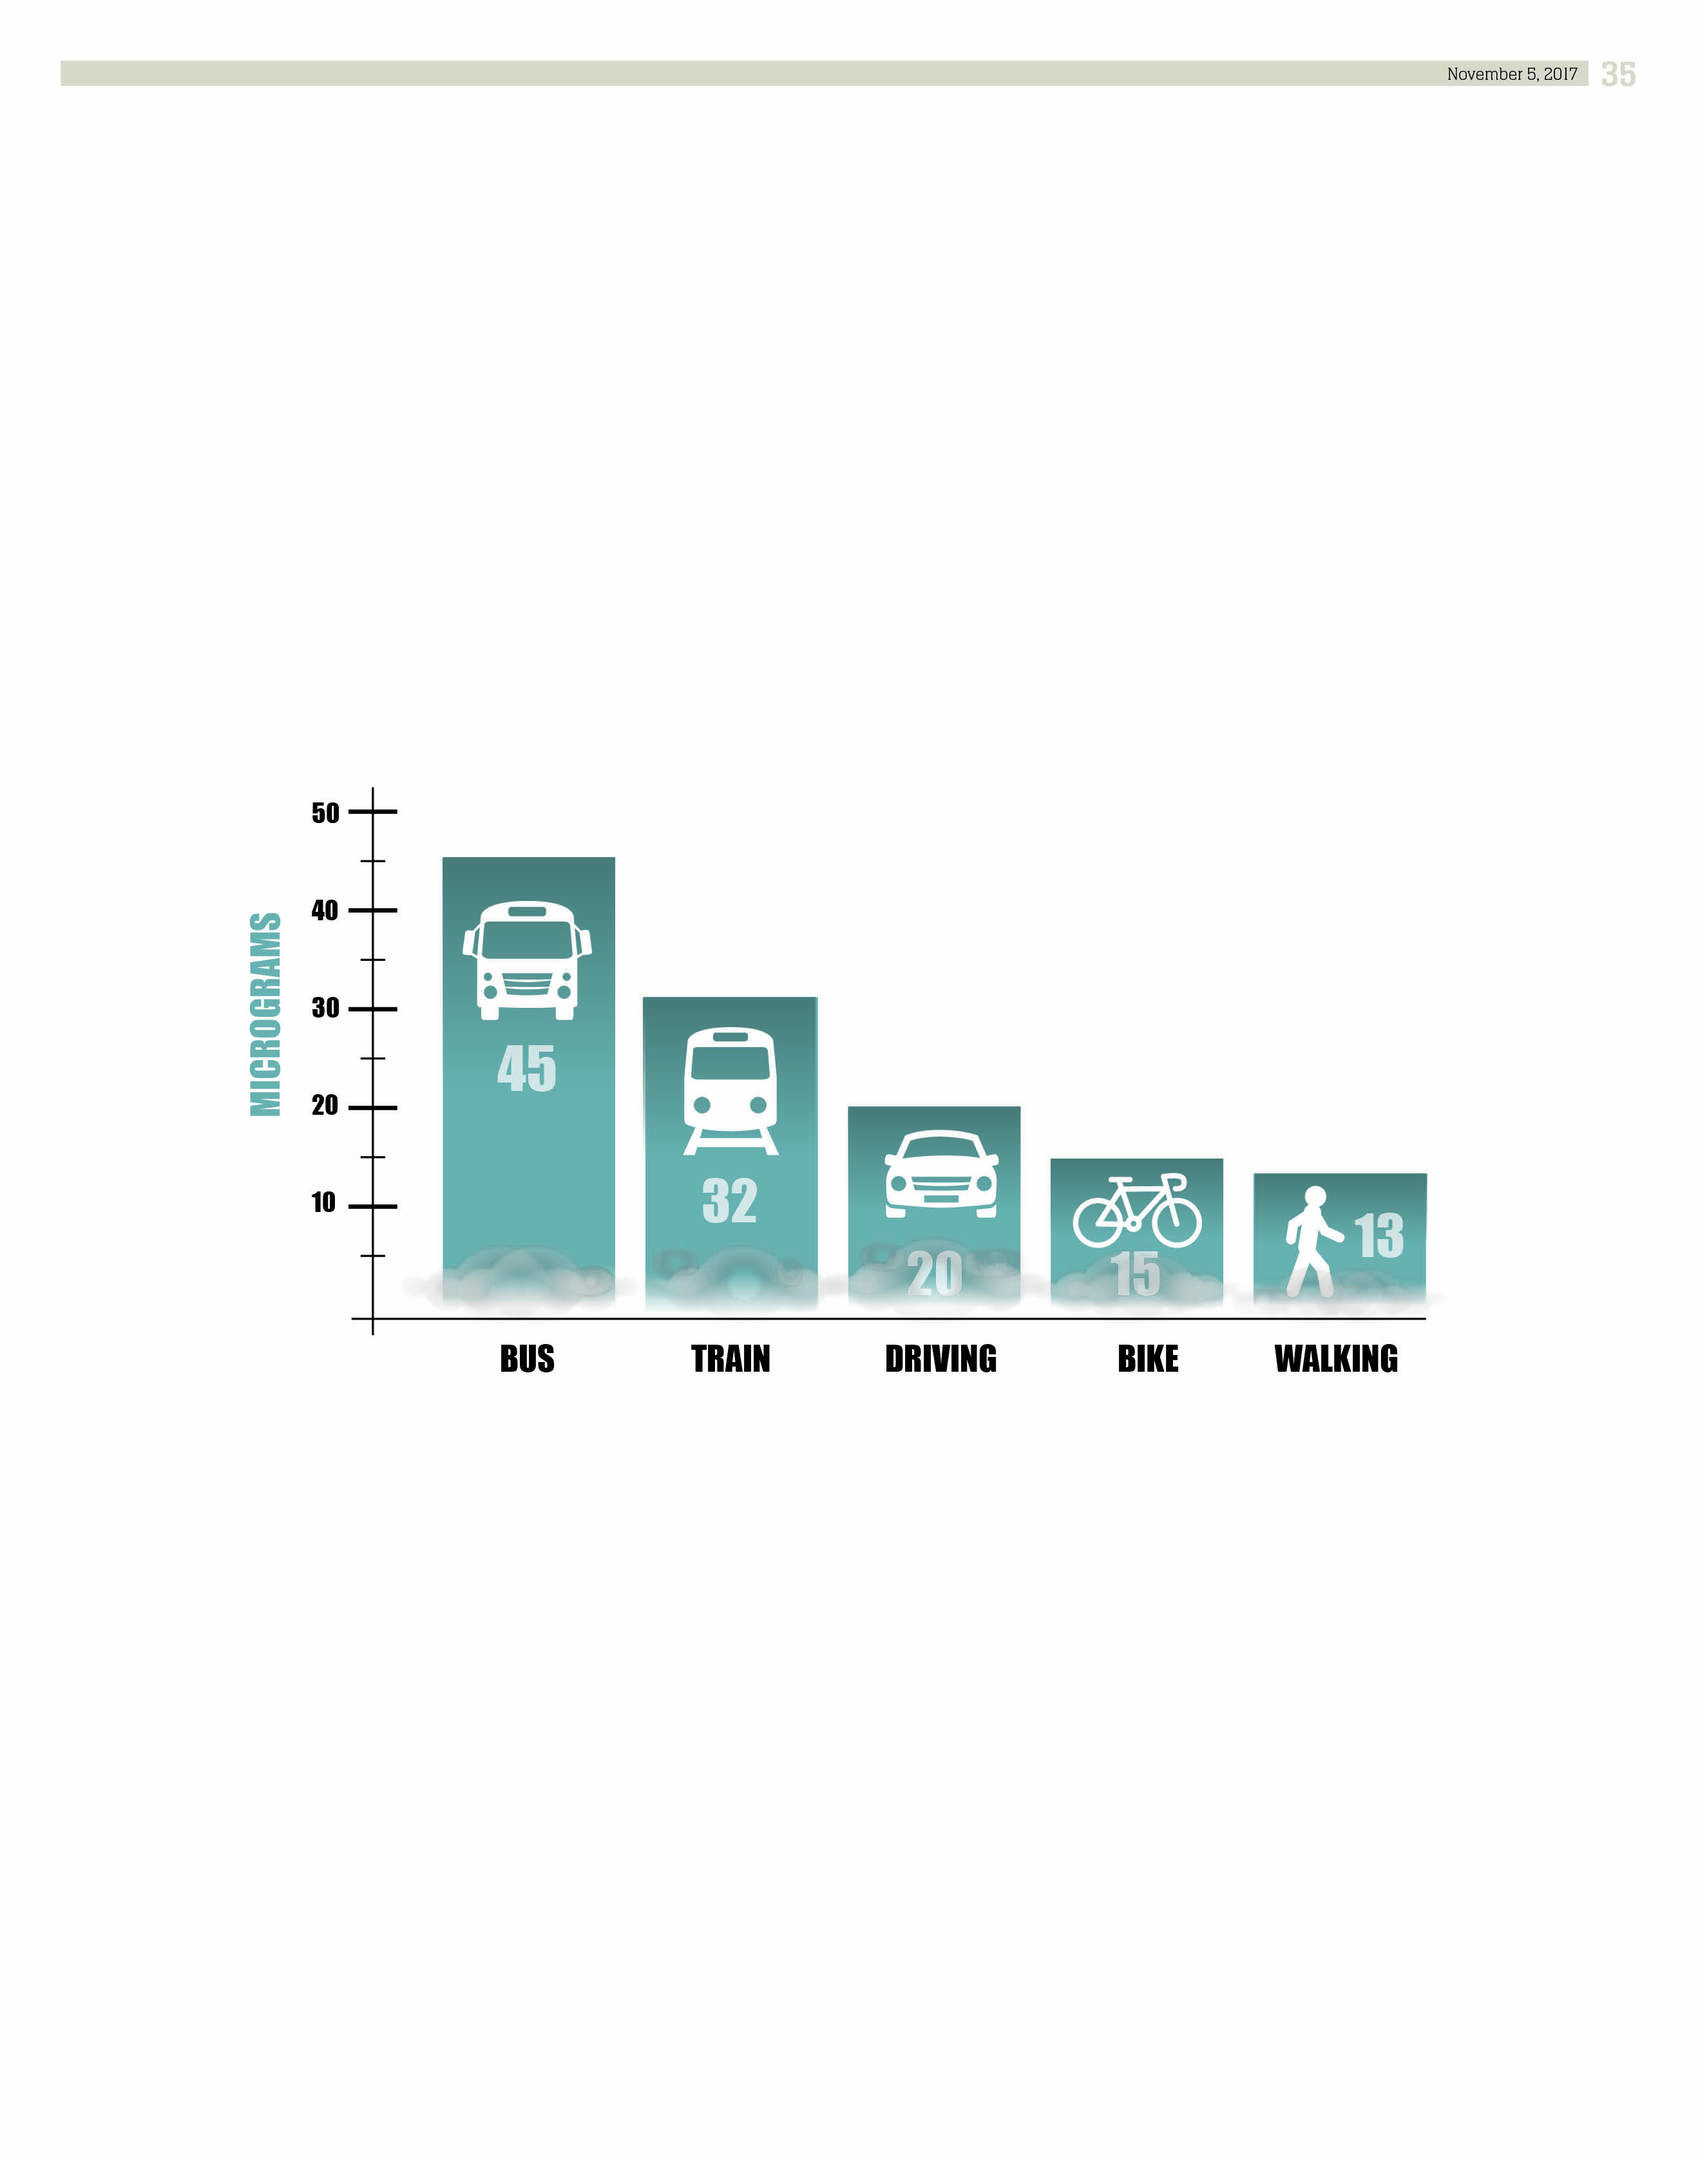
The walker set off first and in their 52-minute journey, the median exposure – the middle of all the readings – was 13 micrograms per cubic meter of air, but in some areas – such as the city’s congestion hotspot Hope Street – one of the 10-second readings jumped to133 micrograms. The safe limit is 25 micrograms across a 24-hour period.
The motorist had a median reading of 20 micrograms and their PM2.5 emissions were at their highest when the car was stuck in traffic getting across Glasgow. For the train passenger, the median rate was 32 micrograms with the highest rates recorded were 97 when the service from Partick went underground at Glasgow Central Station.
On the bike, the journey began on Glasgow’s Dumbarton Road where rates were high but they fell down to safe as soon as the cyclist entered Kelvingrove Park – one measurement topped 157 in the city centre – but the median was 15.
On the bus, the median rate was 45 micrograms but rates rocketed at some busy junctions while the bus was waiting in traffic and also when it waited to cross over the M8 motorway into the city centre.
Enjoy the convenience of having The Sunday Post delivered as a digital ePaper straight to your smartphone, tablet or computer.
Subscribe for only £5.49 a month and enjoy all the benefits of the printed paper as a digital replica.
Subscribe