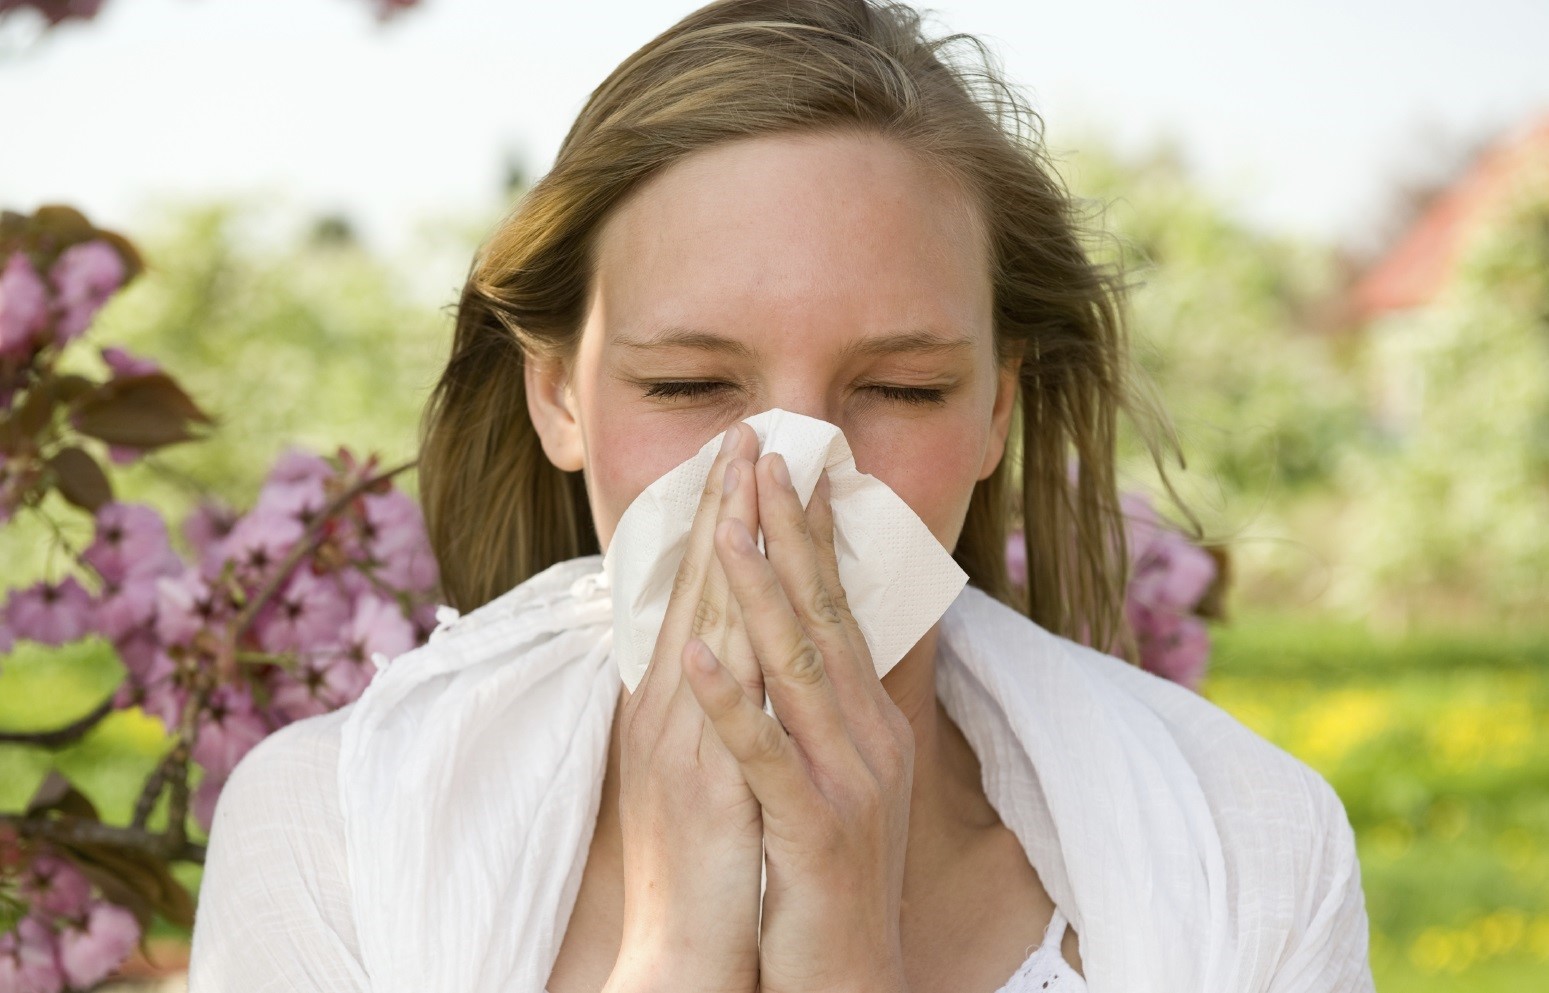
SUFFERERS could have relief from runny noses, sneezing and itchy eyes as scientists have developed the first ever hay fever map of Britain.
The new, highly-detailed maps of the UK contain the location of key plants and trees known to produce pollen that triggers allergies and asthma.
The maps, produced at the University of Exeter in collaboration with the Met Office, may help acute hay fever or asthma sufferers decide where to live or which areas to avoid at peak times when pollen is released.
The study records areas where plants which hay fever sufferers are most likely to be sensitive to are most prevalent, including grasses and trees and plants such as birch, alder, oak and nettle.
The plant maps, which include cities throughout the UK, with a detailed plan of London, will help medics further study the impact of air pollution on asthma.
Around 80% of people with asthma also have a pollen allergy and in the UK around 10% of the adult population is affected by asthma.
In 2001, 13% of people in the UK were diagnosed with hay fever and most people with the condition are allergic to grass pollen, which is most common in late spring and early summer.
Air pollution, for example from car exhaust fumes, is understood to exacerbate hospital admissions for asthma caused by allergies.
The maps have been published as new research carried out at the University of Exeter shows exposure to pollen can increase hospital admissions for asthma within days of exposure.
The scientists believe their maps of allergenic pollen-producing plants, in combination with pollen forecasts and calendars, could help sufferers manage their condition by reducing their exposure.
The maps show a higher percentage of allergenic grass in the northern and western regions of Britain, whereas the eastern central area has the lowest.
Dr Nicholas Osborne, an epidemiologist and toxicologist, said the maps would help doctors narrow down which pollens are most likely to trigger asthma attacks.
“We hope that these maps will contribute to ongoing research that aims to better determine when plants pollenate, allowing us with time to provide better warning to allergy and asthma sufferers to enable them to better manage their disease,” he said.
“In the future, more people will know what species they are allergic to.”
Dr Rachel McInnes, from the Met Office, added: “These maps are a step towards a species-level pollen forecast.
“Pollen can have a serious impact on the well-being of those with hay fever or asthma.
“By working towards a localised, species-level forecast, vulnerable people can better plan their activities and manage their condition.
“These new maps could also provide local authorities and healthcare practitioners with information to assist patients with pollen allergies.
“While these allergenic plant and tree maps do not provide a forecast of pollen levels, they do provide the most likely locations of grass and of tree species which are the source of most allergenic pollen.”
Enjoy the convenience of having The Sunday Post delivered as a digital ePaper straight to your smartphone, tablet or computer.
Subscribe for only £5.49 a month and enjoy all the benefits of the printed paper as a digital replica.
Subscribe