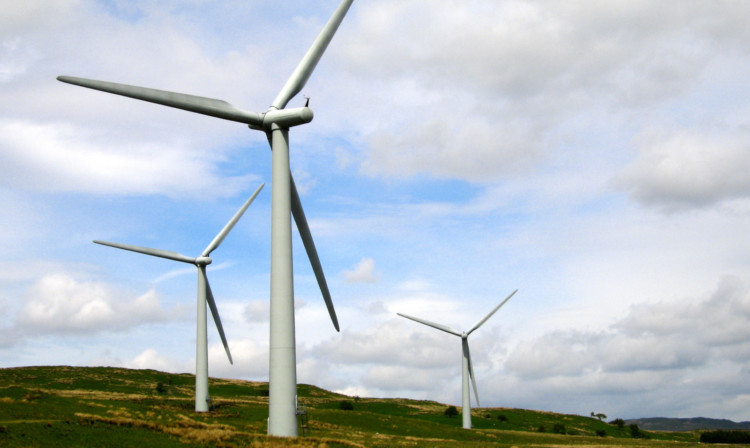
The true cost of the massive expansion of wind farms in England can today be revealed by a special Sunday Post investigation.
Staggering new figures show turbine operators have been handed taxpayer-funded subsidies of £7 billion in just over a decade. That means an average of £1,211 has been paid from the public purse every MINUTE since 2002.
The eye-watering costs are recouped by being added to fuel bills, leaving each household £178 worse off.
Now there is concern at the size of the subsidies being siphoned off for renewables at a time when 2.4 million people in England are living in fuel poverty.
The revelations come in the wake of Prime Minister David Cameron’s announcement that the Conservatives will end their support for onshore wind farms if they win the next election.
Tory MP Philip Davies who represents Shipley in West Yorkshire, said: “Not only are they a blight on the landscape, they are the most expensive, inefficient and unreliable form of energy.
“Many people are struggling to pay their energy bills and the dash for wind energy unnecessarily adds a considerable amount on to everyone’s bills in order to line the pockets of rich landowners.
“It is Robin Hood in reverse taking money from the poorest in order to line the pockets of the richest.
“It is also making our manufacturers extremely uncompetitive when they are up against other firms based abroad who enjoy much cheaper energy bills.”
European law dictates the UK must achieve 15% of its energy consumption from renewable sources by 2020, which has sparked heavily subsidised incentives for large wind farms and individual turbines to be built.
We can reveal between 2002 and December 2013 wind farm owners received £7bn under the renewables obligation scheme which subsidises large-scale green energy production.
Introduced by the Labour Government to encourage investment in renewables, the money is recouped via a supplement added to all domestic and commercial electricity bills.
According to the Renewal Energy Foundation, since 2002 the levy supporting English renewables has added about £178 to the average UK household’s cost of living, with £89 of that in electricity charges alone.
These subsidies have bankrolled 259 operational wind farms with around 850 turbines.
Our probe has found northern England is bearing the brunt of the drive for renewables by hosting half the country’s wind farms. Using Government planning statistics, the Renewable Energy Foundation looked at the number of wind farms in operation or with planning permission across England.
It found Northumberland has the largest wind farm capacity of any county, with around 155 turbines spread over 19 farms, generating up to 302 megawatts (MW).
East Yorkshire is second highest, while Lancashire is sixth, Durham seventh and Cumbria eighth.
Don Brownlow, from Berwick-Upon-Tweed, who has battled a series of large-scale wind farms in Northumberland, claimed developers see the region as an easy target.
He said: “Contrary to popular belief this is not about the region being windy. Most of Northumberland outside the national park is fairly poor for that. The reason, first and foremost among developers, is landowner compliance.
“A lot of wind development in Northumberland has been old estates being broken up which means landowners have borrowed a lot of money to buy them and they see the opportunity to reduce their debts. We are also seen as having compliant local planning authority.”
Across the North West, North East and Yorkshire and the Humber there are 129 wind farms containing around 500 turbines already in operation half of the entire country’s wind energy capacity.
But planning permission has been given for another 100 farms to be built which will add another 330 turbines to the landscape.
It means residents in the north will see a massive 70% increase in the number of turbines, while a further 150 turbines are in the planning system.
Dr John Constable, director of Renewable Energy Foundation, a UK charity publishing data on the energy sector, said: “The northern counties of England are bearing a disproportionate share of the national onshore wind burden.
“Not all of this focus can be explained by better wind conditions.
“Northumberland in particular is relatively windless. I’m afraid the explanation is that developers have picked on the rural north because it lacks the resources to defend itself in the planning system.
“Extremely high subsidies have overheated and corrupted the wind industry; site choice has been poor and little respect has been shown to the opinions of rural populations, whose local environments have too often been significantly damaged.”
A Department of Energy and Climate Change spokesperson said: “As you would expect, there are more wind farms where there is more wind.
“Wind farms will only get planning permission where the impacts including visual impact, cumulative impact and impact on heritage sites are acceptable.
“We have also changed the law to require wind farm developers to consult with local people before they put in a planning application.”
Top 10 counties with most wind farms
1. Northumberland Onshore wind capacity 311MW – Sites 19 – Approximate turbines 155
2. East Yorkshire – 302MW – sites 49 – turbines 151
3. Lincolnshire* – 281MW – sites 22 turbines – 141
4 Cambridgeshire – 273MW – sites 32 -turbines – 136
5. Northamptonshire – 185MW – sites 20 – turbines 92
6. Lancashire – 177MW – sites 23 – turbines – 88
7. Durham – 168MW – sites 24 – turbines – 84
8. Cumbria – 158MW – sites 38 – turbines – 79
9. Devon – 133MW – sites 22 – turbines – 66
10. Cornwall – 130MW – sites 86 – turbines – 65
*Historic county of Lincolnshire, comprised of Lincolnshire, North Lincolnshire and North East Lincolnshire.

Enjoy the convenience of having The Sunday Post delivered as a digital ePaper straight to your smartphone, tablet or computer.
Subscribe for only £5.49 a month and enjoy all the benefits of the printed paper as a digital replica.
Subscribe